
Actual sale outcome
Measurable reliability
Visible estimation uncertainty
The predicted chances of winning are continuously tested against actual sale outcomes.
Coverage rates show whether predicted chances match real-world outcomes in practice.
The band around the curve shows how much uncertainty surrounds the prediction.
THE CORE
The coverage rate shows how
often our predictions
hold up in practice.
A win probability should be accurate.
If the table shows a 75% win probability, that bid should win 75 times if the sale were repeated 100 times under the same conditions.
Estimation uncertainty made visible.
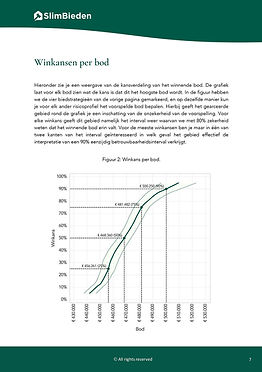
The line shows the predicted win probability for each bid. The band shows the uncertainty around it. The narrower the band, the more certain the estimate; the wider the band, the more cautiously it should be interpreted.
The coverage rate makes reliability measurable.
The coverage rate compares predicted win probabilities with actual sale outcomes that were not used to train the model. The closer the actual outcomes match the predicted probabilities, the higher the coverage rate.
EXAMPLE FROM A REPORT
The smartest bid is the starting point. The curve tells the rest.
The report starts with one specific bid recommendation as a baseline. If you want to look further, you then see four recognisable bidding strategies and the full win-probability curve. This also lets you read the chance of winning for any bid in between. The values below illustrate what you can expect from a calculation tailored to a specific report.
ILLUSTRATIVE REPORT EXCERPT
The four bidding strategies show what extra certainty costs.
The suggested bid is the starting point. The other strategies show how the balance between price and chance of winning changes when you want to bid more cautiously or improve your chances.
What this shows
The suggested bid provides direction. The bidding strategies and curve provide context. This shows how each step upward increases your chance of winning — and the price attached to it.
THREE REAL SLIMBIEDEN REPORTS
The same win chance varies by property.
A bid with a 50% chance of winning is not a fixed premium above the asking price. The model calculates a unique bidding curve for every property, based on factors including location, property type, condition and competition.
The graphs also show the uncertainty margin around the prediction. This margin is often smaller for properties that can be compared well with recently sold homes nearby. It may be wider for unusual properties or homes with few direct comparables.
What this shows
One bid provides direction. The bidding strategies and curve provide context. This shows how each step upward increases your chance of winning and the price attached to it.
CURRENT COVERAGE RATES
How often our predictions proved accurate
We continuously test our model against recently sold properties. We compare the predicted bid amounts with the actual sale price and measure how often the result falls within our predicted margins. We call that percentage the coverage rate.
Bid
One specific
starting point.
The bid with a 50% chance of winning is closest to the property’s expected market value.
Distribution
The full distribution.
The curve shows your chance of winning for every bid, including bids between the four suggested strategies.
Grip
See how precise the estimate is.
The shaded area around the curve shows how much uncertainty surrounds the prediction. The narrower the area, the more confidence the prediction provides.
Coverage
Verified afterwards.
Coverage rates show whether predicted win probabilities historically matched actual sale outcomes.
IN THE REPORT
See how the report reveals what lies behind each bid.
The report shows the suggested bid and the full probability distribution behind it. The graph shows how your chance of winning changes with a higher or lower bid, including the uncertainty margin around that distribution.

FREQUENT QUESTIONS
Questions
you may
still have
What is the difference between a win probability and a coverage rate?
Why do you show several win probabilities instead of one bid?
What if my buying agent recommends a different bid?
What if a property has few comparable sales?
How recent is the data in the report?
Why can’t the report simply say: “bid this amount and you’ll win”?

READY TO PLACE YOUR BID?
Put this proven reliability to work.
Enter the address and receive four well-founded bidding strategies, each showing the predicted chance of winning.
€ 89,- one-time
Instant online
Detailed report
Which property do you want to bid on?
Start with the address. You can verify the property details in the next step.
POSTCODE
NUMBER
ADDITION
No subscription · Your report in 3 minutes